
10.2 Clustering for Image Segmentation
Treat pixels as points and cluster them.
These notes walk through the lecture slides. The original deck is unchanged; use (slides) on the course hub if you want that PDF.
Figures and notes follow Géron, Hands-On Machine Learning; Deisenroth, Faisal, and Ong, Mathematics for Machine Learning; and Theodoridis.
1. Central idea
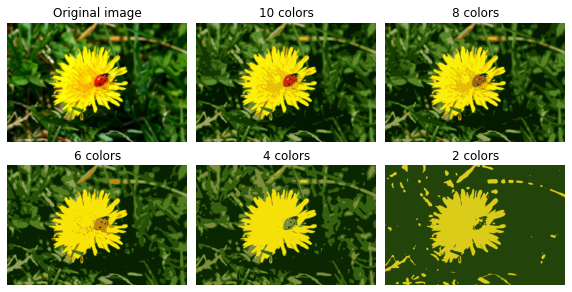
Partition an image into regions that look alike in pixel values.
Method. Cluster pixels by color or intensity.
Why. Pull out objects. Detection, tracking, analysis.
Where this shows up:
- Computer vision. Recognition, scene understanding, classification — first cut the picture into regions that mean something.
- Medical imaging. Tumors, organs, other structures. Segment, then diagnose or plan.
- Satellite images. Land cover, urban growth, environment.
- Other image work. Remote sensing, agriculture, robots, cars, factory QC: detection, features, anomalies.
2. -means on pixels
Treat each pixel as a point in a color space (RGB, for example). Run -means. Assign each pixel to the nearest centroid.
Result: regions of similar color. Boundaries sit where color jumps.
Why people use it: simpler pictures, object detection, compression, features. Cheap.
3. Evaluation
Pixel accuracy. Fraction of pixels whose label matches the ground truth.
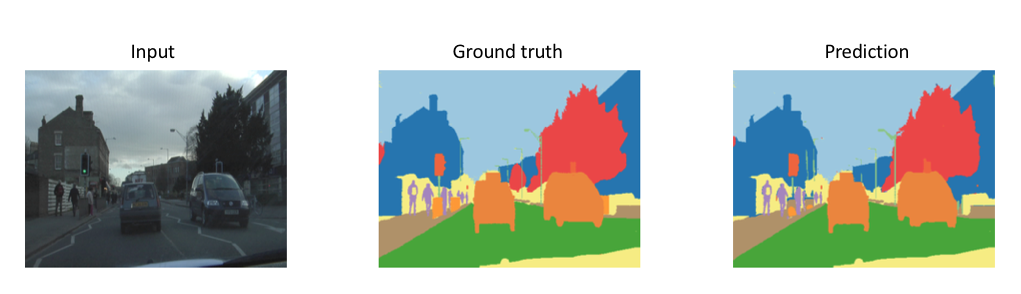
Intersection over Union (IoU). Overlap of the predicted region and the ground-truth region.
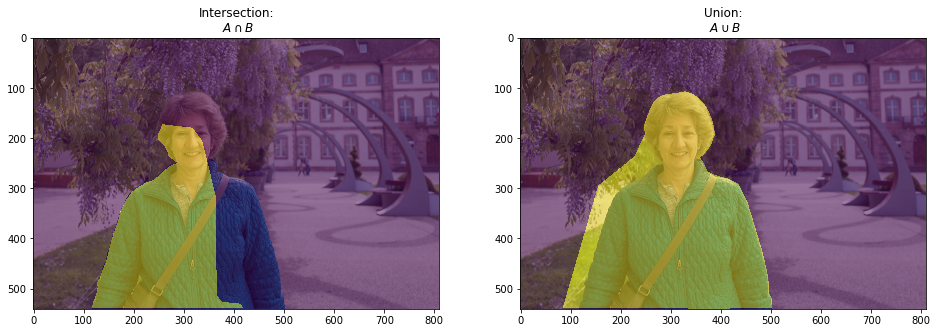
Dice coefficient. Spatial agreement of the segmented region and the ground truth.
Boundary displacement error (BDE). Average distance from predicted edges to ground-truth edges.
Region similarity. Compare regions to the ground truth with structural similarity (SSI) or mutual information (MI).
Practice
-
How does -means treat a pixel when you segment by color?
-
Pixel accuracy can look high when one class fills most of the image. What does IoU check that accuracy misses?
-
Name one setting from the lecture where clustering pixels is the point of the analysis, not a preprocessing trick.