
6.1 Waveforms, Spectrograms, and Time–Frequency Tokens
STFT frames, not 16 kHz samples. Patch the picture the way ViT patched pixels.
These notes match the lecture slides. Use (slides) on the course hub for the deck.
A waveform is a 1-D list of samples. A spectrogram is that list cut into short windows, each turned into a frequency snapshot. Once you have a 2-D time–frequency picture, every vision trick from Week 4 (patches, a transformer, CLIP-style towers) applies to audio. Lab 6 will cut a sine mixture by hand; this hour is why the picture exists.
1. What a spectrogram is
A spectrogram is a picture of sound. Models do not eat 16 kHz samples as a raw list. You record pressure at a sampling rate (16 kHz is a common speech default). A sine of hertz is . Mixtures add; that is still one stream.
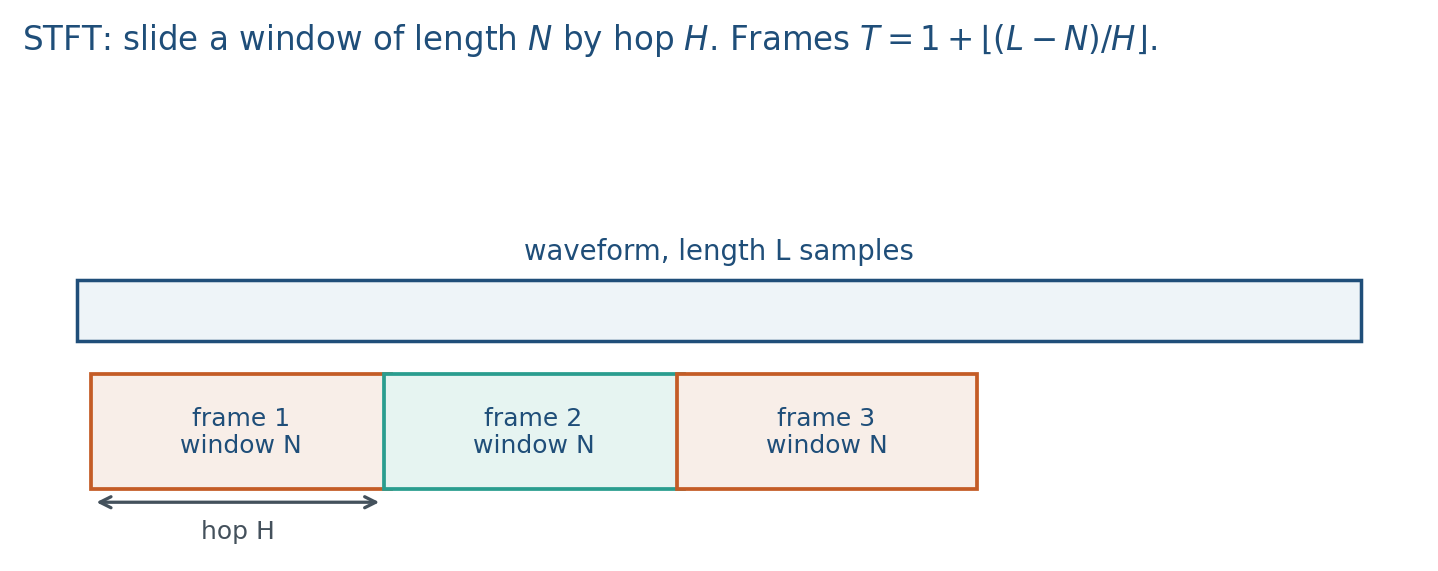
The short-time Fourier transform (STFT) windows the signal (Hann, hop , FFT size ), then takes a DFT of each frame. The magnitude spectrogram is what you plot. Phase exists, but most audio encoders drop it and keep magnitudes or a mel compression of them (log-mel filterbank). A mel spectrogram warps frequency to a perceptual scale.
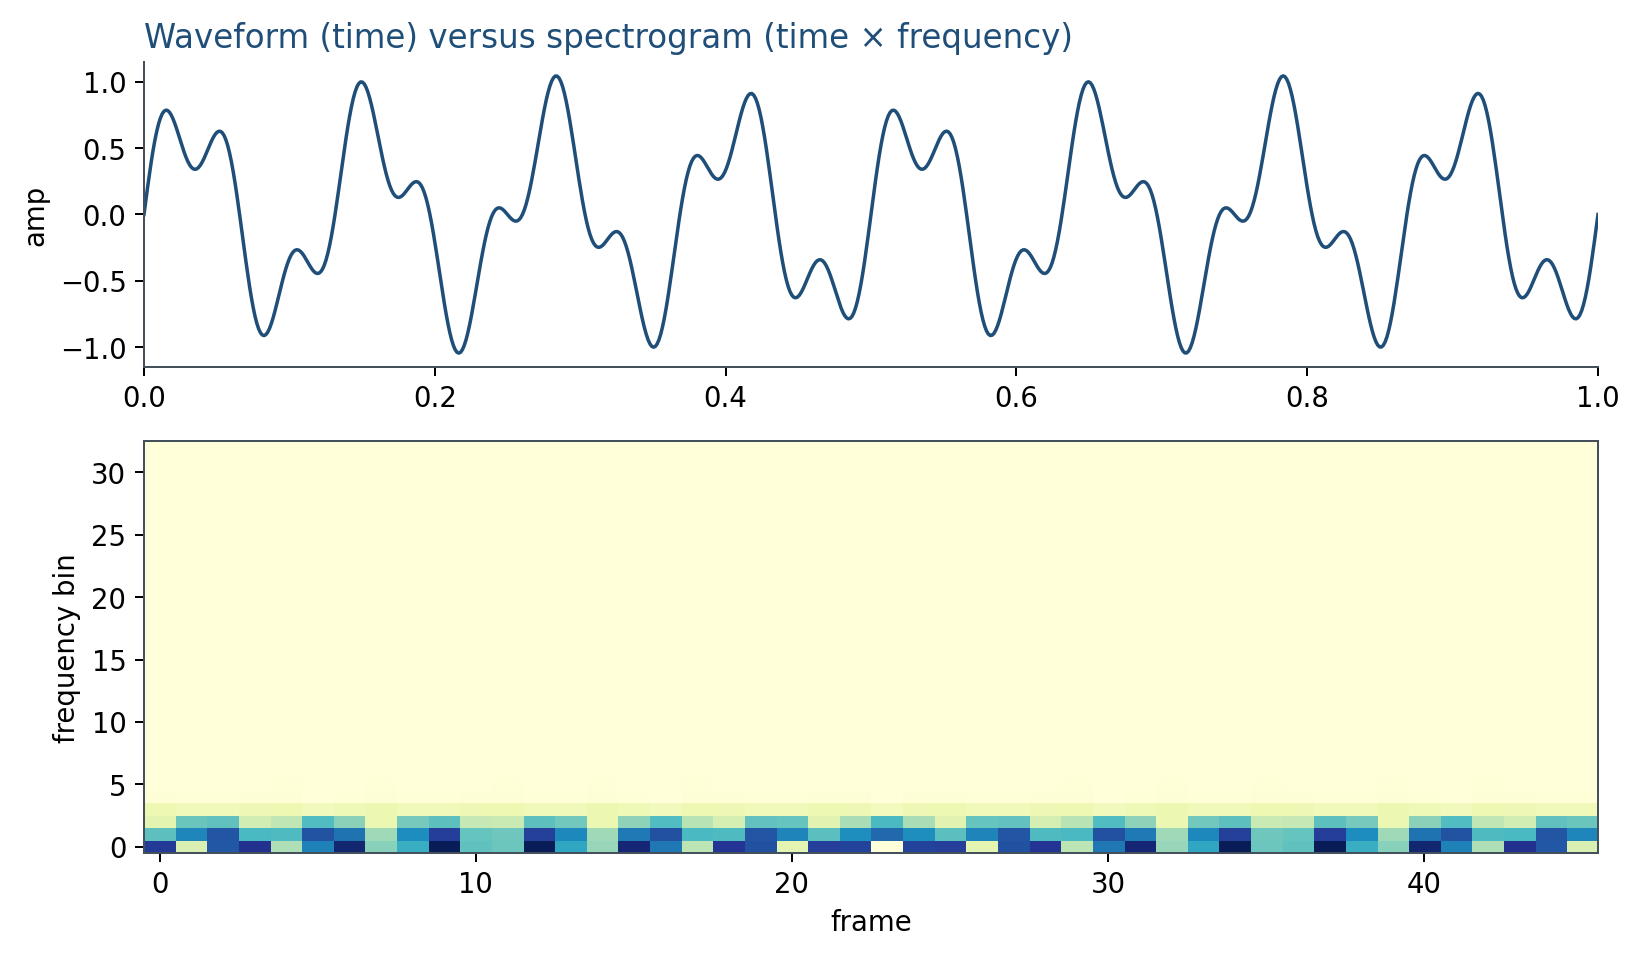
A tall band that stays put is a steady tone. A sweep that climbs is a chirp. Speech looks like stacked formants that move.
Log-mel is a compressive front end: fewer bands than a linear STFT, spaced the way hearing is. It is still a spectrogram. Do not skip the plot; if the 440 Hz band is missing, the rest of the pipeline is theater.
2. Why we use it
Waveforms are long and oscillatory. A transformer on 16 kHz samples would see 16{,}000 tokens per second. An STFT with a 25 ms window and a 10 ms hop sees 100 frames per second. Those frames last long enough to see a phoneme, not a single pressure sample. A 2-D time–frequency map can then be patched like a ViT image.
You cannot make time resolution and frequency resolution arbitrarily fine at once. Hop is the time step; is the frequency resolution. Small means more frames (and more tokens later); large means narrower Hertz bins and a longer window that smears onsets.
If your project uses audio, write , window, hop, and whether you used mel or raw STFT. Those choices change the tokens.
3. Architecture
The boxes connect in that order: waveform, then frames, then STFT magnitudes (optionally mel + log), then patch embed, then transformer.
Treat as a single-channel image. A CNN can ingest it. A ViT can patch it: tiles of time frequency, flatten, linear map to width , add positions. Lab 6 does that cut by hand.
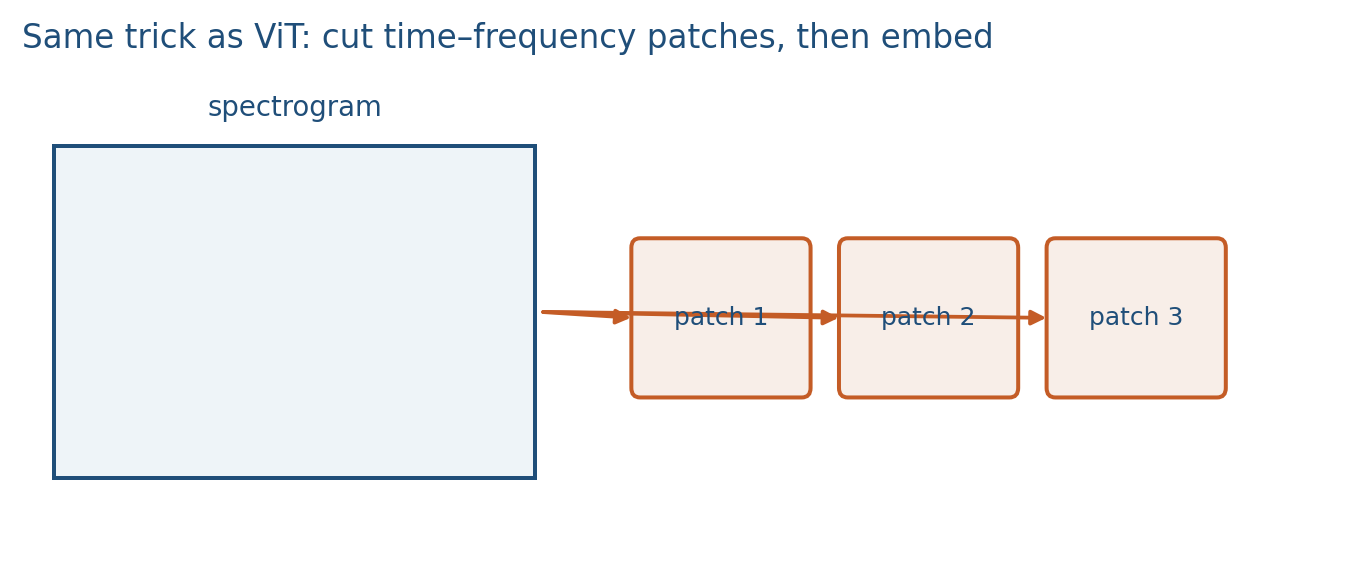
Time is not quite space. Adjacent frequency bins are related (harmonics); adjacent frames are related (smooth speech). Positions should know which axis is which. Still, “patch then attend” is the default modern front end.
Non-overlapping tiles on an grid give tokens if both axes divide. Remainders are padded or cropped; Lab 6 crops.
This front end is not a transcriber. Whisper (note 6.2) will decode text from this picture. CLAP will embed the picture next to a caption.
4. How it works, step by step
Lab 6: sine mixture, STFT, patch. Hop length and window are method knobs.
- Record. Length samples at rate . Duration in seconds is , not the frame count.
- Window. Place frames of length with hop . Hann is the usual taper.
- FFT each frame. Keep magnitudes, or a log-mel filterbank. Phase is usually dropped.
- Check a known tone. Bin of an -point FFT sits near hertz (real FFT: ). That conversion is how you check Lab 6’s two sines.
- Patch. Cut the grid into non-overlapping tiles, flatten, linear map, add positions that know which axis is frequency.
- Hand the tokens to a transformer. Encoding, retrieval, or transcription is a later head, not this picture.
A larger FFT does not “hear more of the clip.” It hears a longer window, so onsets blur; hop still sets the time grid.
5. Mathematical formulas
Frame of the STFT:
The plot is usually , or a mel filterbank of those magnitudes. Frame count, without padding, is
when the length . Sequence length for the transformer is then about frames, or the number of patches of those frames.
Bin sits near hertz. Non-overlapping tiles on an grid give tokens when both axes divide.
6. Positive points and negative points
Positive.
- A spectrogram shares ViT code: patch, position, attend.
- 100 frames per second is a phoneme-scale sequence; 16{,}000 samples per second is not.
- Lab 6 can plot two sines and check the Hertz bins by hand.
Negative.
- Phase is often dropped; reconstruction is not the job of this encoder.
- Time resolution versus frequency resolution is a real tradeoff, not a software default.
- A spectrogram is not yet a transcriber, a speaker id, or a music tag (next note).
- Patching as if it were a square image forgets which axis is frequency; remainders can drop a formant band if you crop carelessly.
When not to. Do not feed raw 16 kHz samples to a transformer and call the spectrogram optional. Do not count samples as frames.
7. What this is not
A spectrogram is not a transcript, a speaker id, or a music tag. Those are tasks on top of the tokens. Whisper (note 6.2) will decode text from this picture. CLAP will embed the picture next to a caption. If your project uses audio, write , window, hop, and whether you used mel or raw STFT. Those choices change the tokens.
Bin of an -point FFT sits near hertz (real FFT: ). That conversion is how you check Lab 6’s two sines.
8. Teaching this note
About 35 minutes at the board in the two-hour week: draw one second of a 440 Hz sine, mark a window of length and hop , count frames, then cut a toy mel grid into patches. Play the STFT video (~10–12 min; see Video). Lab 6 (sine mixture, STFT, concat vs add) is studio time after notes 6.2–6.3, not this block.
9. Worked example
One second of speech at : samples. Take , hop . Window , hop . Those are Whisper’s default front-end numbers (note 6.2).
frames. Each real FFT has bins. A 440 Hz tone sits near bin .
Double the hop to and keep fixed:
About half as many frames; each frame is twice as far apart in time (20 ms). Frequency bins did not change, because did not.
Now patch a log-mel grid of shape with non-overlapping tiles (ignore remainder):
tokens. That is the number Lab 6 is practicing in miniature, and the number a Whisper-style encoder would attend over.
10. Where students get stuck
- Counting samples as frames. is duration in seconds; is how many windows you placed.
- Thinking a larger FFT “hears more of the clip.” It hears a longer window, so onsets blur; hop still sets the time grid.
- Patching as if it were a square image and forgetting which axis is frequency. Remainders: crop in the lab; do not silently drop a formant band.
11. Video
Valerio Velardo — Short-Time Fourier Transform Explained Easily. Play the STFT / spectrogram walkthrough in class (~10–12 min). Pause when the window slides: that hop is in the formula above. Search “Valerio Velardo Short-Time Fourier Transform” if you need the rest of the Sound of AI series. The board hour is the frame count and the patch count, not the complex-phase algebra.
12. Practice
-
You double the hop length and keep fixed. What happens to the number of time frames, and to time resolution?
-
Why is a spectrogram a better input to a transformer than the raw waveform at 16 kHz?
-
Count patch tokens for a mel grid of with tiles (ignore remainder).
-
, one second, , hop . How many STFT frames? What Hertz spacing is one FFT bin ()?
-
Same clip as (4), but you pad so the last frame is included and . What is , and why might a library report that instead of ?