
4.3 dplyr: Groups and Summaries
group_by() marks groups. summarize() collapses them. Always keep n().
1. summarize() collapses rows
After summarize(), you keep only the summaries. Always
think about NA. mean(x, na.rm = TRUE) drops
missing values inside that mean. Filtering both delay
columns first drops any row that is missing either one, so the two means
use the same flights and n() is smaller.
flights |>
  summarize(mean_del = mean(dep_delay, na.rm = TRUE), n = n())
## # A tibble: 1 × 2
## mean_del n
## <dbl> <int>
## 1 12.6 336776n() counts rows in the current table (or group).
2. group_by() makes virtual groups
group_by(origin) does not split the file. It marks the
tibble so later verbs run per group.
ungroup() clears the mark.
One grouping variable: one group per distinct value. Two variables: one group per combination.
flights |>
  group_by(origin) |>
  summarize(
    mean_del = mean(dep_delay, na.rm = TRUE),
    sd_del = sd(dep_delay, na.rm = TRUE),
    n = n()
  )
## # A tibble: 3 × 4
## origin mean_del sd_del n
## <chr> <dbl> <dbl> <int>
## 1 EWR 15.1 41.3 120835
## 2 JFK 12.1 39.0 111279
## 3 LGA 10.3 40.0 104662Always put n() in a grouped summary so you can see
whether a group is tiny.
summarize() peels off one grouping level by default and
prints a message. .groups = "drop" drops all of them.
options(dplyr.summarise.inform = FALSE) quiets the
message.
arrange() ignores groups unless you set
.by_group = TRUE.
Pipe the summary into ggplot2:
flights |>
  group_by(origin, hour) |>
  summarize(mean_del = mean(dep_delay, na.rm = TRUE), .groups = "drop") |>
  ggplot(aes(x = hour, y = mean_del, color = origin)) +
  geom_line() +
  theme_bw()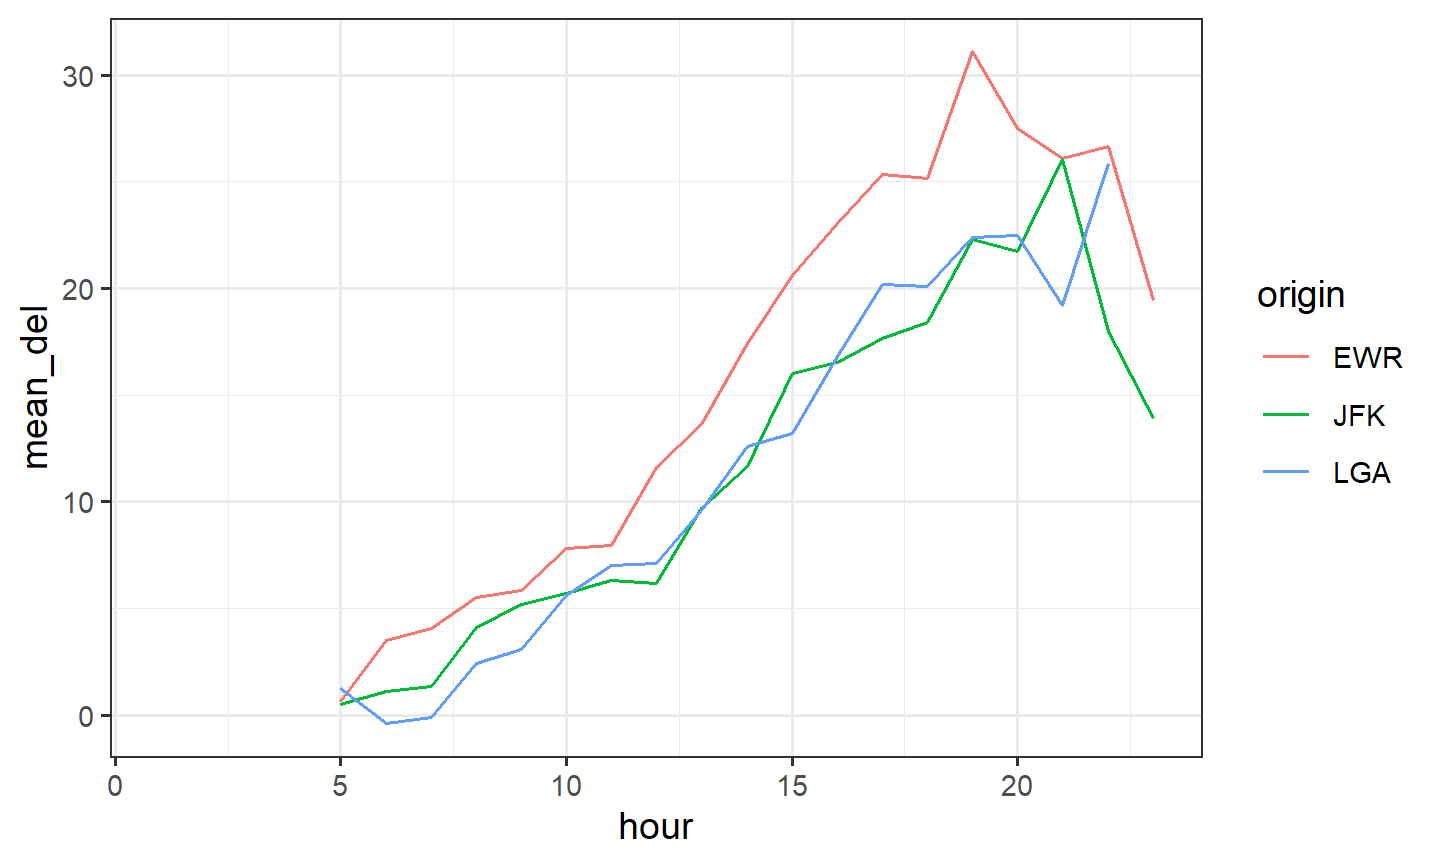
3. This week, in one place
filter()/slice()/arrange()for rowsselect()/rename()/mutate()/relocate()for columnsgroup_by()thensummarize()for one number (or a few) per group
filter() is the dplyr cousin of subset()
for rows. select() is the cousin for columns. Note 2.1.
Chapter 5 of R for Data Science and the data-transformation cheat sheet.
4. Practice
- Standard deviation of
dep_delay. - Maximum
dep_delayat JFK, EWR, and LGA. Then do all three airports in onegroup_by(origin)pipeline. - For each day, the number and proportion of canceled flights, where
canceled means
is.na(dep_delay) | is.na(arr_delay). Plot the proportion against day, and against average departure delay.